Trying to make sense of a messy system can feel like untangling a knot with your eyes closed. Supply chains break, policies backfire, and software projects spiral out of control. The problem isn’t a lack of effort. It is a lack of the right mental models. Systems thinking gives you a set of lenses to see the hidden connections, feedback loops, and leverage points that drive outcomes. In 2026, these skills are not optional. They are essential for anyone who wants to build resilient strategies in business, engineering, or policy.
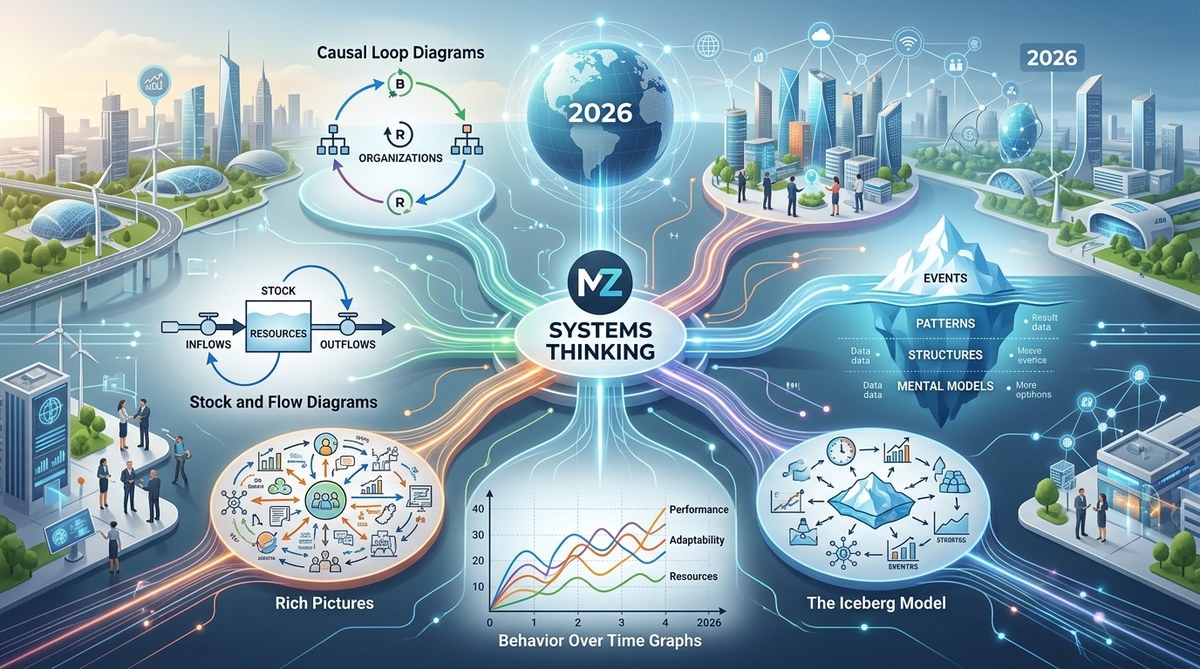
Systems thinking tools help you see the structures behind everyday problems. The Iceberg Model keeps you from reacting to surface events. Causal loop diagrams reveal feedback loops that either amplify or balance change. Stock and flow models show where resources accumulate or drain away. Systems archetypes identify recurring patterns like fixes that fail. Behavior over time graphs map trends instead of snapshots. Together they form a practical toolkit for tackling complexity in 2026.
Why These Tools Matter More Than Ever
The world in 2026 moves faster than any single person can track. Algorithms reshape markets overnight. Climate policies create ripple effects across continents. A decision in one department can derail a whole company. Traditional linear thinking assumes cause and effect are close in time and space. That assumption breaks down constantly now. Systems thinking tools replace guesswork with structure. They help you spot unintended consequences before they snowball. They also reveal where a small push can unlock big change. For a deeper look at how these frameworks reshape organizations, see harnessing systems thinking to drive organizational innovation.
The Five Essential Tools for 2026
Each tool below solves a specific type of complexity. You don’t need to master all five at once. Start with the one that matches your current headache.
Tool 1: The Iceberg Model
The iceberg model forces you to look below the surface. Most people react to events: a sales drop, a customer complaint, a delayed shipment. That level is only the tip. Underneath are patterns of behavior, then structures (policies, systems, physical constraints), and finally mental models (assumptions and beliefs that hold everything in place).
Example: A hospital sees rising readmission rates. The event is the readmission. The pattern is that readmissions spike every quarter. The structure includes discharge procedures and follow up scheduling. The mental model might be “patients are responsible for their own recovery.” Changing that belief could shift the entire system.
Steps to apply the iceberg model:
- Write down the specific event or crisis you are facing.
- Look for repeated patterns in the data over weeks or months.
- Identify the structures (rules, resources, incentives) that create those patterns.
- Ask what mental models or assumptions keep those structures in place.
Use this tool when you keep fighting the same fire again and again.
Tool 2: Causal Loop Diagrams
Causal loop diagrams map the feedback loops that drive behavior over time. They use arrows with plus and minus signs to show how one variable influences another. The loops can be reinforcing (growing or collapsing) or balancing (stabilizing or correcting).
Example: A tech startup trying to grow fast. More users attract more developers, which improves the product, which brings more users. That is a reinforcing loop. But too many users without enough server capacity leads to slow performance, which drives users away. That is a balancing loop. Drawing these loops helps you see where growth will hit a limit.
Common mistakes when drawing causal loop diagrams:
- Confusing correlation with causation. Ask “does A really change B?”
- Forgetting to include delays. Many effects take weeks or months to appear.
- Making the diagram too large. Focus on the loop that matters most.
To explore how these diagrams apply to business ecosystems, read applying systems thinking to transform global business ecosystems.
Tool 3: Stock and Flow Diagrams
Stocks are accumulations of something: inventory, cash, trust, carbon in the atmosphere. Flows are the rates that add to or drain from stocks. The key insight is that stocks change slowly, even when flows are large.
Example: Consider a warehouse that ships 100 units a day but receives 120 units. The stock (inventory) grows by 20 units per day. If you only look at the flow rates, you might think the system is balanced. But the stock tells you that space is running out. Stock and flow models are invaluable for supply chain planning, budget management, and any situation where accumulation matters.
Simple table comparing stock and flow:
| Concept | Definition | Example |
|---|---|---|
| Stock | An accumulation that changes over time | Number of employees in a company |
| Inflow | Rate that increases the stock | New hires per month |
| Outflow | Rate that decreases the stock | Resignations per month |
| Net change | Inflow minus outflow | Current hiring gap |
Use this tool when you need to understand delays and buffers in a system.
Tool 4: Systems Archetypes
Systems archetypes are recurring storylines that play out across different fields. Recognizing one saves you from reinventing the wheel. Classic archetypes include “Fixes That Fail,” “Tragedy of the Commons,” “Shifting the Burden,” and “Success to the Successful.”
Example: A city tries to reduce traffic by building more roads. That fix works for a while, but it encourages more driving, which eventually leads to worse congestion. This is “Fixes That Fail.” The solution is not more roads but a leverage point like congestion pricing or public transit investment.
“A system is not the sum of its parts; it is the product of their interactions.”
* Milan Zeleny, pioneer in systems thinking and management theory
Understanding archetypes helps you spot why previous solutions didn’t stick. For a broader framework on reshaping management practices through systems thinking, check out applying systems thinking to transform modern management practices.
Tool 5: Behavior Over Time Graphs
Behavior over time graphs (BOTGs) plot a variable’s value across months or years. Unlike a bar chart that shows a snapshot, a BOTG reveals trends, oscillations, and thresholds. It is the simplest tool in the set, but one of the most powerful for aligning a team’s perception.
Example: Plot the average response time for a customer support team over 12 months. You will likely see seasonal spikes and a gradual increase as product complexity grows. The graph alone can spark a conversation about resource allocation and automation. BOTGs work best when you pair them with causal loop diagrams to explain the shape of the curve.
Benefits of using behavior over time graphs:
- Forces everyone to agree on what the data actually looks like.
- Highlights delays between cause and effect.
- Shows whether a problem is getting better or worse at a glance.
- Helps distinguish between normal variation and structural change.
Using the Tools Together
Each tool on its own is useful. Combined, they become a full diagnostic kit. Start with a behavior over time graph to spot a troubling pattern. Build a causal loop diagram to explain why that pattern exists. Use the iceberg model to find the mental models behind the structure. Then check for a matching systems archetype to anticipate the likely outcome of your intervention.
When to use which tool:
| Situation | Best Tool |
|---|---|
| A recurring crisis that won’t go away | Iceberg Model |
| Understanding why growth is stalling | Causal Loop Diagrams |
| Inventory, cash, or resource management | Stock and Flow Diagrams |
| Recognizing a pattern you’ve seen before | Systems Archetypes |
| Communicating a trend to your team | Behavior Over Time Graphs |
Making Systems Thinking a Daily Habit
You don’t need to become a certified systems modeler to benefit. Start small. Pick one tool and apply it to a current problem this week. Draw it on paper. Talk it through with a colleague. The real power comes from repeated use, not one time mastery. Over 2026, these five tools will change how you see complexity. They will help you move from fighting symptoms to reshaping the underlying structure.
For a broader view of how systems thinking connects to economic resilience, see why systems thinking is the key to unlocking economic resilience in 2026. And if you are ready to take your practice further, explore 7 systems thinking principles every leader must know in 2026.
Start with one loop, one graph, or one iceberg today. The knot is easier to untangle when you can see the threads.
Leave a Reply