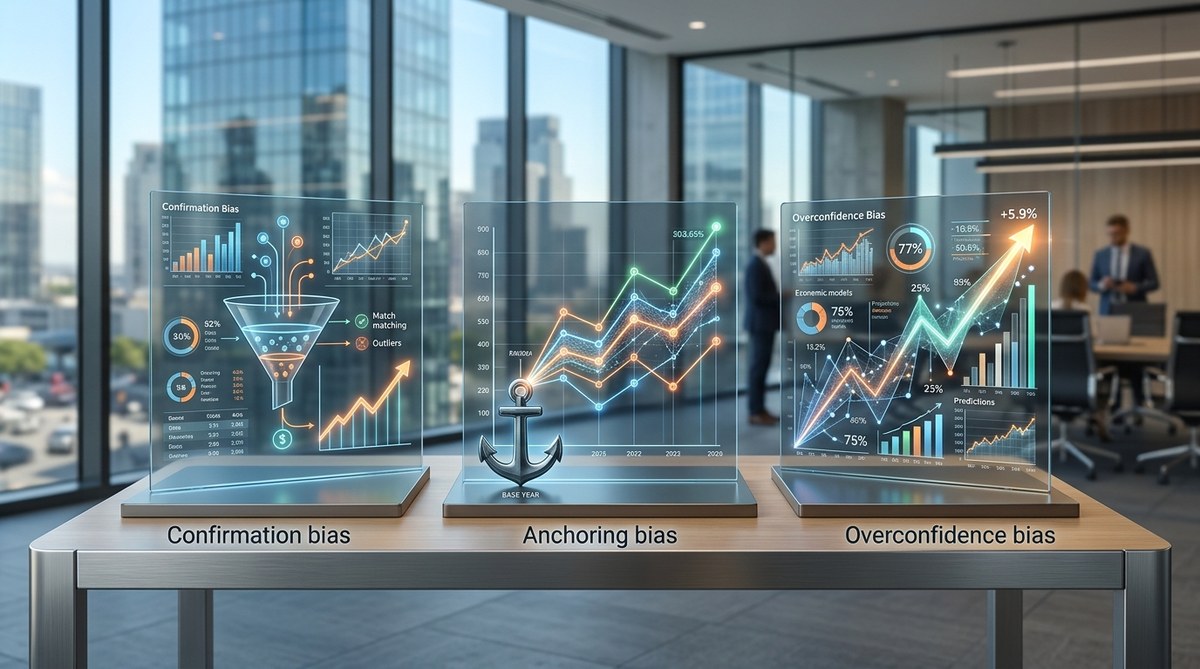
Every morning, a new economic forecast lands on your screen. GDP growth. Inflation projections. Unemployment trends. You read them. You weigh them. Maybe you even make a decision based on them. But what if the forecast itself is built on a foundation that is quietly, systematically wrong? Not because of bad data or lazy analysts, but because of three hidden biases baked into the very structure of how we predict economic outcomes. These are not simple statistical errors. They are systemic biases in economic forecasts, and they distort almost every number you see.
Economic forecasts are not neutral. They suffer from three structural biases: the stability bias that ignores nonlinear change, the aggregation bias that hides critical variation, and the feedback loop blindness that misses how predictions alter outcomes. Recognizing these flaws lets you read any forecast with sharper eyes and make better strategic calls.
The Stability Bias: When Forecasts Assume Tomorrow Looks Like Today
Most economic models are built on the assumption that the future will resemble the recent past. This sounds reasonable. It is also deeply misleading. The stability bias causes forecasters to underestimate the probability of sudden shifts, because their tools are calibrated to a world that moves in gentle curves.
Think about the 2008 financial crisis. Almost no major forecasting body predicted it. The models were looking at steady housing prices and low default rates from the previous few years. They extrapolated. They did not see the nonlinear tipping point building in the subprime mortgage system.
The same pattern repeats in 2026. Supply chain forecasts assume linear recovery. Inflation models assume steady decline. But real economies do not move in straight lines. They move in jumps, lags, and feedback-driven surges.
How the stability bias shows up in practice:
- Forecasts rely on historical averages that smooth out extreme events.
- Models treat volatility as a temporary anomaly, not a structural feature.
- Long-term projections become increasingly confident, even as uncertainty grows.
A better approach is to treat stability as a rare condition, not a default. When you read a forecast that predicts a smooth path, ask yourself: what would have to break for this to be wrong? For a deeper look at how this connects to broader decision-making, read about harnessing systems thinking to drive organizational innovation.
The Aggregation Bias: What Gets Lost When You Average Everything
The second systemic bias in economic forecasts is the aggregation bias. This happens when analysts combine diverse regional, sectoral, or demographic data into a single national or global number. The average looks stable. But the components underneath are moving in opposite directions.
Consider the US labor market in 2025. The national unemployment rate looked healthy. But that single number masked a deep divide. Tech hubs were booming with hiring. Rural manufacturing regions were shedding jobs. The aggregate forecast predicted steady growth, while half the country was already in a downturn.
The aggregation bias creates three specific distortions:
- It hides divergence. Two opposite trends cancel each other out, making the system look calm.
- It masks risk. A few weak sectors can trigger cascading failures, but the average shows no warning.
- It misleads policy. National numbers drive federal decisions, but local realities are often the opposite.
A comparison of forecasting approaches:
| Forecasting Method | Handles Aggregation Bias? | Risk of Missing Local Shocks | Best Use Case |
|---|---|---|---|
| Simple averaging | No | High | Stable, homogenous systems |
| Weighted sector models | Partial | Medium | National policy planning |
| Systems thinking with disaggregation | Yes | Low | Complex, diverse economies |
| Machine learning on microdata | Partial | Medium | Pattern recognition, not causation |
If you want to see how this connects to building more resilient structures, consider the ideas in the role of systems thinking in shaping future economic models. The goal is not to throw out aggregation entirely. It is to demand forecasts that show the distribution, not just the average.
Feedback Loop Blindness: When Predictions Change the Outcome
The third bias is the most subtle. Forecasts are not neutral observations. They change the system they are trying to predict. This is called feedback loop blindness, and it is one of the most common systemic biases in economic forecasts.
A classic example is a recession forecast. If a major institution predicts a downturn, businesses freeze hiring. Consumers cut spending. Banks tighten lending. The forecast becomes a self-fulfilling prophecy. Conversely, a rosy growth forecast can create overconfidence, leading to overinvestment and a subsequent crash.
Feedback loops distort forecasts in two directions:
- Reinforcing loops: The forecast amplifies the predicted trend, making it more extreme.
- Balancing loops: The forecast triggers counteracting behavior that reduces the predicted effect.
Central banks understand this. That is why they sometimes hide their inflation projections or use vague language. They know that publishing a specific number can trigger panic buying or wage demands that make the prediction come true.
“The most dangerous forecast is the one that people believe without question. It changes their behavior in ways the model never accounted for.”
This quote from a senior economist at the Federal Reserve highlights a critical point. Forecasts are not just information. They are interventions. When you read a prediction, ask: who is reading this? How might they act on it? What new feedback loop does that create?
For a practical guide on spotting these dynamics in your own organization, check out how systems thinking exposes hidden feedback loops in your business strategy.
How to Read Any Economic Forecast with Clearer Eyes
You do not need to build your own models to protect yourself from these biases. You just need a new mental checklist. Here is a three-step process you can apply to any forecast you encounter in 2026.
Step 1: Identify the baseline assumption.
Look for the hidden stability bias. Does the forecast assume the recent past will continue? Does it include scenarios for nonlinear change, or only smooth trajectories? If the answer is the latter, discount the confidence level by at least 30 percent.
Step 2: Ask for the distribution, not just the average.
Push back on aggregation bias. Demand to see regional breakdowns, sector splits, or demographic variations. If the forecast only shows a single number, treat it as incomplete. The real story is in the variance.
Step 3: Map the feedback loops.
Think about who will see this forecast and how they will react. Will businesses change their behavior? Will consumers? Will policymakers? If the forecast is widely reported, assume it will alter the system. Adjust your expectations accordingly.
Common mistakes when evaluating forecasts:
- Trusting a forecast because it comes from a prestigious institution.
- Ignoring the difference between a point estimate and a range.
- Assuming past accuracy predicts future accuracy.
- Overlooking the time lag between a forecast and the data it is based on.
These steps are not foolproof. But they will make you a more critical consumer of economic information. For a broader view of how these principles apply to global markets, read how systems thinking helps leaders anticipate market disruptions in 2026.
Why These Biases Persist in 2026
You might wonder why, after decades of criticism, these systemic biases in economic forecasts still exist. The answer is not incompetence. It is institutional inertia.
Forecasting agencies are rewarded for being wrong in the same direction as everyone else. If you predict a recession and it does not happen, you look cautious. If you predict growth and a crash comes, you lose credibility. So forecasters cluster around consensus. They smooth their numbers. They avoid sticking out.
There is also a mathematical comfort in linear models. They are easier to build, easier to explain, and easier to defend. Systems thinking requires complexity. It requires admitting that the model is always incomplete. That is harder to sell to a board or a congressional committee.
But the cost of ignoring these biases is high. Bad forecasts lead to bad capital allocation. They lead to policy that arrives too late. They lead to investors making moves based on a reality that does not exist.
To understand how this connects to larger economic structures, consider reevaluating traditional economic models through systems thinking. The shift is not about abandoning forecasts. It is about understanding their limitations.
Reading Between the Lines of Every Forecast
The next time you open a report from the IMF, the Fed, or a major bank, do not just look at the numbers. Look at the assumptions. Look at what is being averaged out. Look at who will read it and how they will react.
That is where the real insight lives.
Economic forecasts are not crystal balls. They are maps drawn by humans with blind spots. The three biases we covered today are not the only ones, but they are the most common and the most damaging. Stability bias makes you miss the turning point. Aggregation bias hides the cracks. Feedback loop blindness lets you forget that the map changes the territory.
You can use this understanding to make better decisions. Not perfect ones. But better than the crowd.
For a final piece of context on how to apply this thinking to your own strategic planning, take a look at why systems thinking is essential for navigating economic complexity in 2026. The tools are there. The awareness is the first step.
Start with the next forecast you see. Read it with suspicion. Read it with curiosity. And read it knowing that the numbers on the page are only part of the story. The rest is hidden in the system itself.
Leave a Reply